Gaining insights from Airbnb data, from a host’s perspective

Let’s take a look at Airbnb listings data from 2016, to see what story it tells.
Specifically, we’ll be asking three questions of the data.
Educators
This analysis was done as part of the Data Scientist Nanodegree. They provided links to the data, walkthroughs of scikit learn, etc.
Tool
This analysis was completely run in python.
(Specifically in a jupyter notebook)
Dataset
Airbnb provided Seattle data for 2016.
- Listings: This is much like what you’d see on a real estate page. The neighborhood, bed count, etc.
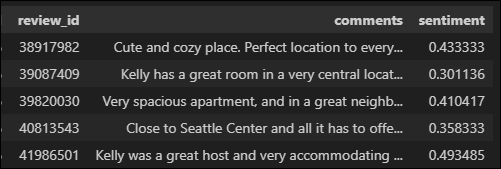
- Reviews: Reviews for a listing, identified with a reviewer id.
- Calendar: Day by day listing of what days are available, and what the listed price is.
Question 1) How does the listing’s summary, space, and description length impact the annual income.
For this question, we’re looking at, are more words better? Should you spend some extra time fleshing out your listing’s descriptions?
For this one we measured the length of the description, summary, and space fields, and added them together for each listing.
Next, we looked at that listing’s calendar, identified the bookings as days when the listing wasn’t available, and estimating the booking price as the price shown for neighboring available days.
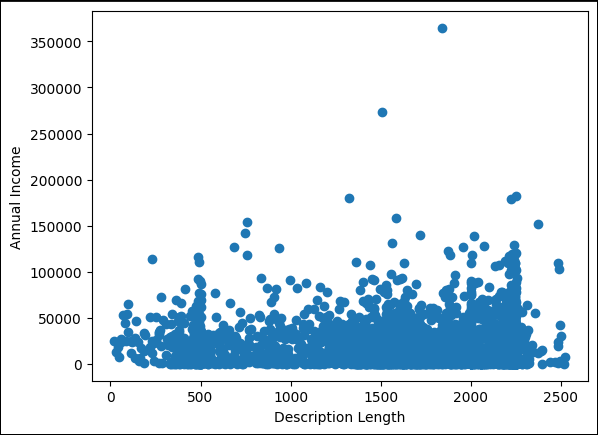
Looking at this graph, There’s no real relationship. There’s plenty of listings with short descriptions that are just as profitable as listings with very long descriptions.
And mathematically, we’re seeing a correlation of -0.03
Given that correlation is from -1 to 1. It is hard to get more in the middle than -0.03
Conclusion
The description length does not have any significant impact on the annual income.
Question 2) Does local vs distant hosts impact the average review sentiment
For this question we are asking if whether the host lives in the same city as the property impacts the written review that renters leave.
We’re hypothesizing that renters want the host to live in the same city as the property. In my mind this is getting to the faceless management corporation vs local owner mentality.
We started off by tagging each listing with a binary value for if the host is local or not. The host’s location in the dataset is a free-form field, normally identifying their city, state, or country. But occasionally it’s “We live upstairs” or “We live in the same home”. Terms that mentally we can identify as local, but don’t match the city/state/country format that other listings have.
So we ran with the logic:
- if we see ‘seattle’, ‘house’, or ‘home’ then they’re local.
- if we see ‘wa’ or ‘washington’ and not ‘DC’ then we believe they’re in the state, so “local”
- If we don’t see any of the above words, then they’re not local.
A quick spot check showed this as sufficiently accurate logic.
Next we used the TextBlob library to calculate the sentiment of each review. This is running some language processing logic to rate from -1 to 1 whether these are bad/angry reviews or good/happy reviews.
Now that we have our review sentiment and host locality, let’s plot this as a histogram to see the distribution.
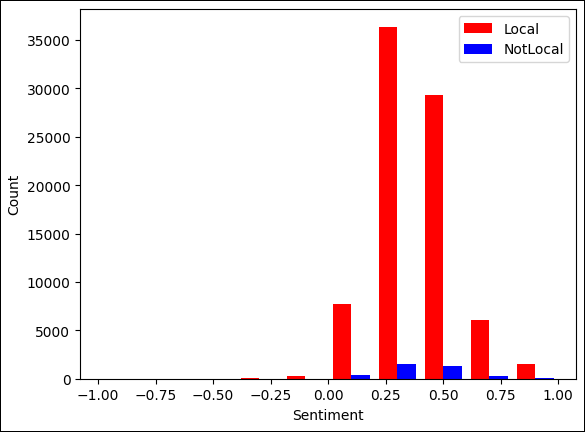
Obviously there’s an imbalance between local hosts and non local hosts. But they appear to follow a largely similar distribution with reviews averaging vaguely positive sentiment.
And when we calculate the correlation, we get 0.0007. So even MORE middle of the road than the description length vs annual income!
So we have determined that no, host locality does not impact a listing’s review comments.
Question 3) What factors lead to a listing’s rental rate
Finally we’re going to look into what factors impact how many times a listing gets rented during the year.
From the available data we’re going to look at:
- The length of the write up for transit options
- The length of the write up about the host
- the number of listings the host owns
- accommodates (The number of people the property accomodates)
- bathroom count
- bedroom count
- bed count
- price
- minimum length of a booking
- review scores for overall rating, cleanliness, communication, and location
- host response time (converted into dummy variables)
- whether the host has a profile picture
- whether the listing is instantly bookable
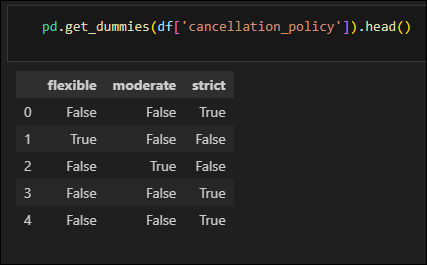
- how strict or lax the cancellation policy is (converted into dummy variables)
This question actually required a lot less feature engineering than the previous questions (we’re largely just using existing variables) but it did require a bit more data cleansing (dealing with Nulls, blanks, etc.)
The only feature engineering (other than converting categorical variables to dummy) was counting how many bookings each listing had during 2016.
Since most of the numeric variables were “counting” variables (count of beds, etc) we did not have to worry too much about standardization, as we would have if we were including dimensions (sq feet), etc.
For this question we used a linear regression model, as each variable’s coeffecients (Betas) would give us a good indication of their importance.
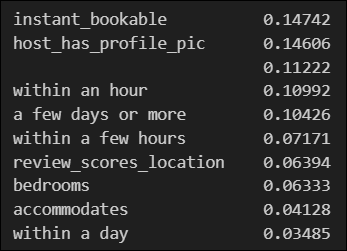
We see the first several important variables are whether the host has a profile picture, how quickly the host responds to renters, and whether the listing is instantly bookable.
Only after that do we start to see physical listing attributes like the number of bedrooms.
This tells me that the hosts have a large impact on how much business the listing receives.
Conclusion
We looked at several business questions inspired by the data Airbnb provided. Our hypotheses were shown false twice. (Correlation was very close to zero)
However, we did find some actions hosts can do to potential improve the number of bookings they get over the course of a year.